
TruBridge, Inc. (NASDAQ:TBRG) Shares Could Be 25% Below Their Intrinsic Value Estimate
 Shares Could Be 25% Below Their Intrinsic Value Estimate")
 Shares Could Be 25% Below Their Intrinsic Value Estimate")
Key Insights
-
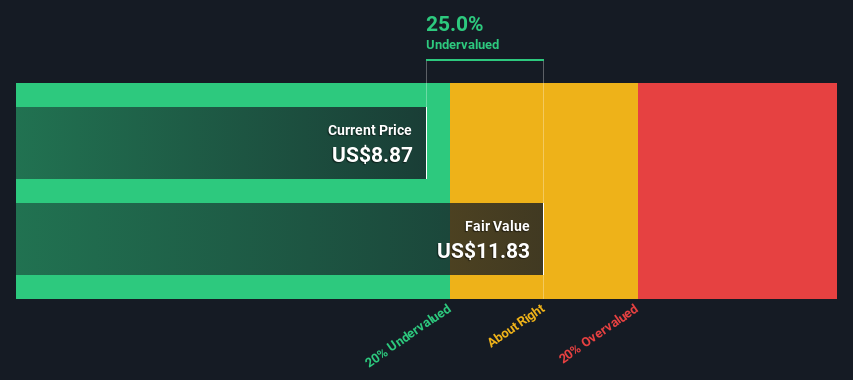
Using the 2 Stage Free Cash Flow to Equity, TruBridge fair value estimate is US$11.83
-
TruBridge’s US$8.87 share price signals that it might be 25% undervalued
-
Our fair value estimate is 16% lower than TruBridge’s analyst price target of US$14.00
Today we will run through one way of estimating the intrinsic value of TruBridge, Inc. (NASDAQ:TBRG) by projecting its future cash flows and then discounting them to today’s value. The Discounted Cash Flow (DCF) model is the tool we will apply to do this. Before you think you won’t be able to understand it, just read on! It’s actually much less complex than you’d imagine.
Companies can be valued in a lot of ways, so we would point out that a DCF is not perfect for every situation. Anyone interested in learning a bit more about intrinsic value should have a read of the Simply Wall St analysis model.
Check out our latest analysis for TruBridge
Step By Step Through The Calculation
We use what is known as a 2-stage model, which simply means we have two different periods of growth rates for the company’s cash flows. Generally the first stage is higher growth, and the second stage is a lower growth phase. To begin with, we have to get estimates of the next ten years of cash flows. Where possible we use analyst estimates, but when these aren’t available we extrapolate the previous free cash flow (FCF) from the last estimate or reported value. We assume companies with shrinking free cash flow will slow their rate of shrinkage, and that companies with growing free cash flow will see their growth rate slow, over this period. We do this to reflect that growth tends to slow more in the early years than it does in later years.
Generally we assume that a dollar today is more valuable than a dollar in the future, and so the sum of these future cash flows is then discounted to today’s value:
10-year free cash flow (FCF) estimate
|
2024 |
2025 |
2026 |
2027 |
2028 |
2029 |
2030 |
2031 |
2032 |
2033 |
|
|
Levered FCF ($, Millions) |
US$5.28m |
US$11.9m |
US$13.1m |
US$14.1m |
US$15.0m |
US$15.8m |
US$16.4m |
US$17.0m |
US$17.6m |
US$18.1m |
|
Growth Rate Estimate Source |
Analyst x1 |
Analyst x1 |
Est @ 10.22% |
Est @ 7.84% |
Est @ 6.18% |
Est @ 5.01% |
Est @ 4.20% |
Est @ 3.62% |
Est @ 3.22% |
Est @ 2.94% |
|
Present Value ($, Millions) Discounted @ 10% |
US$4.8 |
US$9.8 |
US$9.8 |
US$9.6 |
US$9.2 |
US$8.8 |
US$8.3 |
US$7.8 |
US$7.3 |
US$6.8 |
(“Est” = FCF growth rate estimated by Simply Wall St)
Present Value of 10-year Cash Flow (PVCF) = US$82m
After calculating the present value of future cash flows in the initial 10-year period, we need to calculate the Terminal Value, which accounts for all future cash flows beyond the first stage. The Gordon Growth formula is used to calculate Terminal Value at a future annual growth rate equal to the 5-year average of the 10-year government bond yield of 2.3%. We discount the terminal cash flows to today’s value at a cost of equity of 10%.
Terminal Value (TV)= FCF2033 × (1 + g) ÷ (r – g) = US$18m× (1 + 2.3%) ÷ (10%– 2.3%) = US$232m
Present Value of Terminal Value (PVTV)= TV / (1 + r)10= US$232m÷ ( 1 + 10%)10= US$87m
The total value, or equity value, is then the sum of the present value of the future cash flows, which in this case is US$169m. To get the intrinsic value per share, we divide this by the total number of shares outstanding. Compared to the current share price of US$8.9, the company appears a touch undervalued at a 25% discount to where the stock price trades currently. The assumptions in any calculation have a big impact on the valuation, so it is better to view this as a rough estimate, not precise down to the last cent.
The Assumptions
The calculation above is very dependent on two assumptions. The first is the discount rate and the other is the cash flows. If you don’t agree with these result, have a go at the calculation yourself and play with the assumptions. The DCF also does not consider the possible cyclicality of an industry, or a company’s future capital requirements, so it does not give a full picture of a company’s potential performance. Given that we are looking at TruBridge as potential shareholders, the cost of equity is used as the discount rate, rather than the cost of capital (or weighted average cost of capital, WACC) which accounts for debt. In this calculation we’ve used 10%, which is based on a levered beta of 1.736. Beta is a measure of a stock’s volatility, compared to the market as a whole. We get our beta from the industry average beta of globally comparable companies, with an imposed limit between 0.8 and 2.0, which is a reasonable range for a stable business.
Moving On:
Valuation is only one side of the coin in terms of building your investment thesis, and it shouldn’t be the only metric you look at when researching a company. DCF models are not the be-all and end-all of investment valuation. Rather it should be seen as a guide to “what assumptions need to be true for this stock to be under/overvalued?” For instance, if the terminal value growth rate is adjusted slightly, it can dramatically alter the overall result. Why is the intrinsic value higher than the current share price? For TruBridge, there are three relevant aspects you should assess:
-
Risks: As an example, we’ve found 1 warning sign for TruBridge that you need to consider before investing here.
-
Future Earnings: How does TBRG’s growth rate compare to its peers and the wider market? Dig deeper into the analyst consensus number for the upcoming years by interacting with our free analyst growth expectation chart.
-
Other High Quality Alternatives: Do you like a good all-rounder? Explore our interactive list of high quality stocks to get an idea of what else is out there you may be missing!
PS. The Simply Wall St app conducts a discounted cash flow valuation for every stock on the NASDAQGS every day. If you want to find the calculation for other stocks just search here.
Have feedback on this article? Concerned about the content? Get in touch with us directly. Alternatively, email editorial-team (at) simplywallst.com.
This article by Simply Wall St is general in nature. We provide commentary based on historical data and analyst forecasts only using an unbiased methodology and our articles are not intended to be financial advice. It does not constitute a recommendation to buy or sell any stock, and does not take account of your objectives, or your financial situation. We aim to bring you long-term focused analysis driven by fundamental data. Note that our analysis may not factor in the latest price-sensitive company announcements or qualitative material. Simply Wall St has no position in any stocks mentioned.
Source link


