
Opinion: S&P 500 chart is still bullish even as stronger headwinds hit the market

The U.S. stock market, as measured by the S&P 500 Index, ran into trouble earlier this week as it reacted negatively to the U.S. consumer-price index report. But prices bounced back the next day, and at this point it seems similar to the sharp one-day correction that took place at the end of January.
Even so, this turbulence could still be the beginning of something more significant, since the negative divergences â February is often negative, cumulative volume breadth is lagging and small-cap stocks are struggling â are still in place.
At this point, the S&P 500âs
SPX
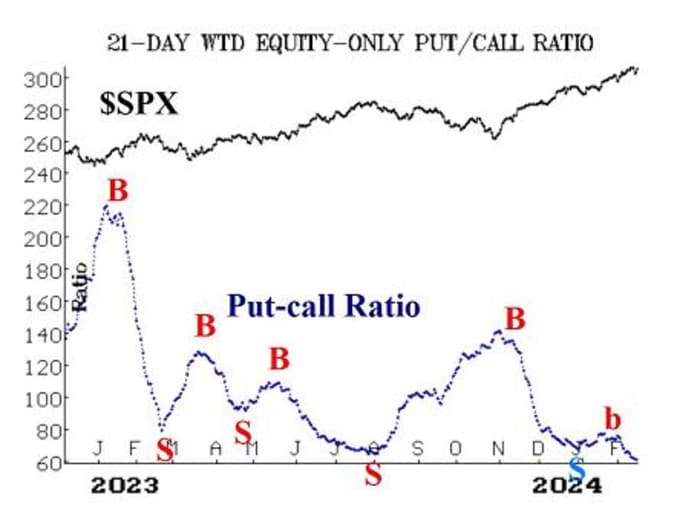
chart is still bullish. These pullbacks have not even reached the rising 20-day moving average. The horizontal red lines on the accompanying SPX chart show where there is support â at the lows of each of those two sharp pullbacks, then more significantly at 4,800 and, finally, at the January lows around 4,680.Â
There has been another âclassicâ âmodified Bollinger Bandâ (mBB) sell signal. We do not trade those. The âclassicâ signal occurs when SPX first closes above its +4Ï Band and then later closes below its +3Ï Band. This signal occurred on the sharp pullback on Feb. 13 and is marked with a small green âsâ on the SPX chart. These signals have often been subject to whipsaws, and that has happened with some frequency lately.
So, we wait for the full confirmation of a McMillan Volatility Band (MVB) before taking a position. That would occur if SPX falls to 4,903, but there is no guarantee that just because there has been a âclassicâ sell signal that there will be a MVB sell signal that follows.
Equity-only put-call ratios have been dropping recently, and this downward trend in the ratios is bullish for stocks. That is, these ratios remain on buy signals. The fact that these ratios are already at the lower regions of their charts means that they are overbought (the weighted ratio hasnât been this low since November 2021). Even so, they wonât generate sell signals until they turn and begin to trend upward.
Market breadth has been all over the place. Recent buy and sell signals both have failed to sustain. Both breadth oscillators are back on buy signals, but there needs to be confirmation of that on the New York Stock Exchange today. That is, if breadth is positive on the NYSE today, then both breadth oscillators will have confirmed buy signals. Breadth has certainly not kept pace with the rise in SPX, and cumulative volume breadth (CVB) is lagging even further behind.Â
New highs on the NYSE continue to dominate new lows, for the most part. There was one day this week when new lows outnumbered new highs, but that has to be the case for two consecutive days in order to stop out the current buy signal from this indicator. Thus, this buy signal is still in place.Â
VIX
VIX
VX00,
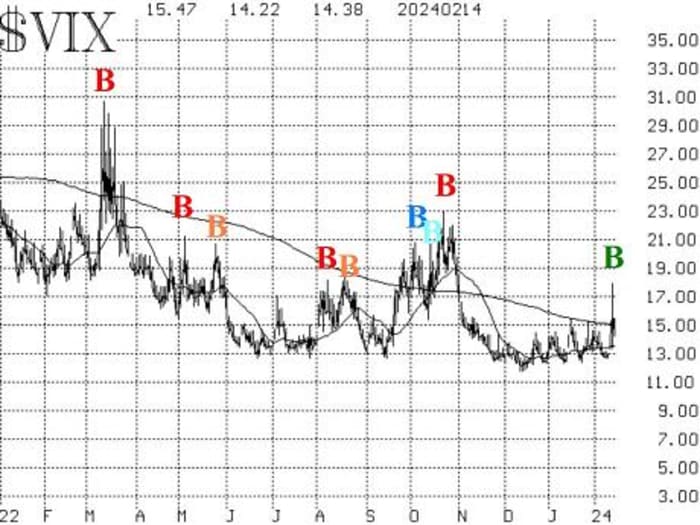
finally showed some interest in a market decline, as it shot upward and closed above its declining 200-day moving average. That was enough to stop out the trend of VIX buy signals that had been in place since last November. VIX traded as high as 17.94 on the day of the large market decline, Feb. 13. However, as soon as the market began to rally back, VIX collapsed. It has now fallen far enough to generate a new âspike peakâ buy signal (green âBâ on the accompanying VIX chart), and if it remains below its 200-day moving average for two consecutive days, it will re-establish the trend of VIX buy signals as well. So, it briefly looked like VIX was getting ânervous,â but in the end it was not.
The construct of volatility derivatives has remained bullish in its outlook for stocks despite the one-day selloff this week. March VIX futures are now the front month, and so we are watching their price versus that of the April VIX futures. If March were to rise above April, that would be negative for stocks, but there hasnât been any sign of that happening.
In summary, we are maintaining a âcoreâ bullish position because of the positive overall nature of the SPX chart. We are trading other confirmed signals are that âcore.â
New recommendation:Â VIX âspike peakâ buy signal
This buy signal (for the stock market) occurs when VIX spikes up and then later closes at least 3.0 points below that spike peak. The peak was at 17.94 on Feb. 13, and VIX closed at 14.38 on Feb. 14, so the buy signal is in effect.
Buy 2 SPY
SPY
March 15 at-the-money calls: We will hold for 22 trading days (about one calendar month), in line with the parameters of the trading system we have developed for the âspike peakâ buy signals. Moreover, the trade would be stopped out if VIX subsequently closes above 17.94.
New recommendation:Â Potential MVB sell signal
This is a new recommendation for a MVB sell signal, replacing the old one that was not filled. A âclassicâ modified Bollinger Band (mBB) sell signal has occurred. We donât trade those, but we will trade a McMillan Volatility Band (MVB) sell signal if that is confirmed. Specifically, that would be confirmed if SPX were to trade at 4,903 or lower. That price is fixed, so it remains there in the following days as well as today. Frankly, it seems unlikely that this sell signal will be confirmed, but we are making the recommendation in case it is.
If SPX trades at 4,903 or lower, then buy 1 SPY Mar (28th) at-the-money put and sell 1 SPY Mar (28th) put with a striking price 25 points lower: If this trade is established, it would have a target of the lower -4Ï Band, and it would be stopped out if SPX were to close above the +4Ï Band.
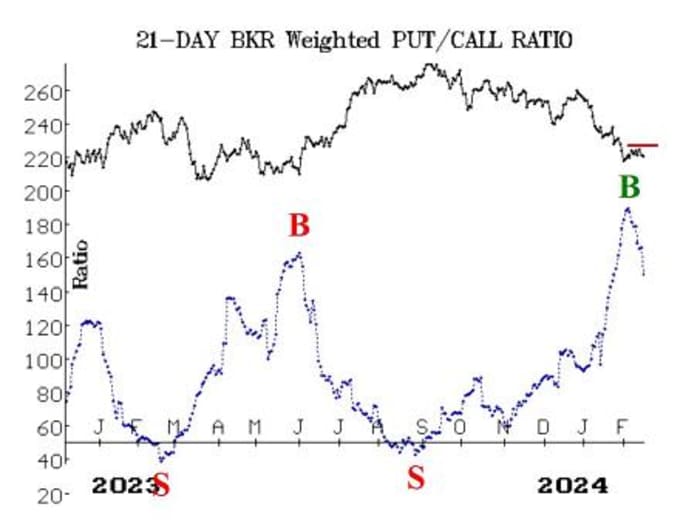
New recommendation:Â Baker-Hughes (BKR)
The weighted put-call ratio for Baker-Hughes Co.
BKR,
has generated a buy signal, and several other put-call ratio signals in BKR have been accurate in the last year (see chart). However, there is some overhead resistance in place, so we are going to make this a conditional recommendation:
If BKR closes above 30, buy 4 BKR April 19 30 calls in line with the market: If these calls are bought, we will hold as long as the weighted put-call ratio remains on a buy signal.
Follow-up action:
All stops are mental closing stops unless otherwise noted.
We are using a âstandardâ rolling procedure for our SPY spreads: In any vertical bull or bear spread, if the underlying hits the short strike, then roll the entire spread. That would be roll up in the case of a call bull spread or roll down in the case of a bear put spread. Stay in the same expiration and keep the distance between the strikes the same unless otherwise instructed.Â
Long 4 expiring XLP
XLP
Feb. 16 72 calls:Â Roll to the March 15 73 calls. The stop remains at 72.60.
Long 1 expiring SPY Feb. 16 501 call: This position was initially a long straddle. It was rolled up, and the puts were sold. The calls were rolled up several more times. This is, in essence, our âcoreâ bullish position. Roll to the SPY March 8 501 calls. Roll the calls up every time they become at least eight points in-the-money.
Long 1 expiring SPY Feb. 16 500 call: This was originally a long straddle. The call was rolled up, most recently on Feb. 2, and the put was sold. Roll to the SPY March 8 500 call. Roll up every time the call is eight points in-the-money. The closing remains at 486.Â
Long 3 TLT
TLT
May 19 95 puts: We will hold as long as the put-call ratio sell signal is in place for T-bonds.
Long 1 expiring SPY Feb. 16 502 call: This call was bought in line with the new highs vs. new lows buy signal. Stop out if NYSE new lows exceed new highs for two consecutive days. Roll to the SPY March 8 502 call. Roll up every time the call is eight points in-the-money.
Long 1 SPY March 1 498 put: This put was bought in line with several negative divergences that exist currently, but primarily the breadth-oscillator sell signals. Breadth has swung wildly positive and negative this week, but the bottom line is that the NYSE breadth oscillator is on the brink of returning to a buy signal. It would be better to use a price stop, though, than to try to discern the status of the breadth oscillators as the next week proceeds. So, stop out of this trade if SPX closes above 5,027, which it did on Thursday.
Long 1 SPY March 15 494 put and short 1 SPY March 15 469 put: This spread was bought when VIX closed above 15.30 on Feb. 13. That is, when VIX closed above its 200-day moving average. Stop out if VIX closes below its 200-day moving average for two consecutive days. It has already closed below for one day, so because it closed below 15.10 on Thursday, this stops out the trade.
All stops are mental closing stops unless otherwise noted.
Send questions to: lmcmillan@optionstrategist.com.
Lawrence G. McMillan is president of McMillan Analysis, a registered investment and commodity trading advisor. McMillan may hold positions in securities recommended in this report, both personally and in client accounts. He is an experienced trader and money manager and is the author of the best-selling book, âOptions as a Strategic Investment.â www.optionstrategist.com
©McMillan Analysis Corporation is registered with the SEC as an investment advisor and with the CFTC as a commodity trading advisor. The information in this newsletter has been carefully compiled from sources believed to be reliable, but accuracy and completeness are not guaranteed. The officers or directors of McMillan Analysis Corporation, or accounts managed by such persons, may have positions in the securities recommended in the advisory.
Source link
:max_bytes(150000):strip_icc()/AMDChart-e0150a9b8e5040bcbf156ea48a9cec55.GIF?w=390&resize=390,220&ssl=1 "AMD Stock Tumbles as Full-Year Data Center Outlook Disappoints")
:max_bytes(150000):strip_icc()/GettyImages-1231125234-62eebac3a3294c4fbb7bd374bb350108.jpg?w=390&resize=390,220&ssl=1 "Super Micro Computer Stock Slumps After Revenue Miss, Guidance Boost on AI Demand")

:max_bytes(150000):strip_icc()/GettyImages-1915741110-4bd1168e746d41a9ab3a6569bb5a15c2.jpg?w=390&resize=390,220&ssl=1 "Amazon Beats Earnings and Revenue Estimates on AWS, Advertising Growth")