

The records keep tumbling. The Nasdaq Composite
COMP
has joined the S&P 500
SPX
in securing a new high. Early Friday futures suggest a marginal dip from those levels at the opening bell.
The S&P 500 has risen four months in a row, gaining 21.5%, its best four-month advance since July 2020, according to Dow Jones Market Data.
But that’s the sort of momentum that gets some market observers twitchy. Bearish traders of a technical bent portentously tap their computer screens to highlight the warnings being flashed by their favorite momentum gauge: the 14-day relative strength index, or RSI.
However, Mark Newton, head of technical strategy at Fundstrat, says that though many RSI readings are elevated it does does not mean stocks currently are vulnerable.
Before we explain Newton’s thinking, let’s examine RSI a bit more. Having a rising RSI is a positive signal for a stock, for it shows buying momentum is picking up, relative to selling. A falling RSI is the opposite and is bad for those long of a stock.
But RSI becomes most useful as a short-term contrarian indicator at extremes. If the RSI has surged very high it suggests the market is getting too excited and a reversal may be due. That overbought threshold is placed at an RSI of 70, according to most market technicians. An oversold RSI is below 30.
It should be noted that not all RSI are equal. One difference is that smaller cap stocks (which are more vulnerable to retail investor herding) that also have a high beta (they normally move more than the underlying market) can more easily reach the RSI extremes.
And Newton notes another difference: that overbought territory is different between daily, weekly and monthly charts. Shorter-term traders can claim markets or individual stocks are overbought when daily indicators like the traditional 14-day RSI move above 70. Longer-term investors may focus on the weekly and/or monthly RSI.
In essence, Newton shows in the table below that a pullback in say the S&P 500 members because daily RSI became overbought is likely to be short-term and that the upward trend can then be resumed.
“Over a three, six, and 12 month basis, when SPX constituents have climbed over 70%, gains have largely mirrored the percentages when RSI is under 70. Thus, being overbought in and of itself, does not seem to be a hurdle towards further gains,” says Newton.
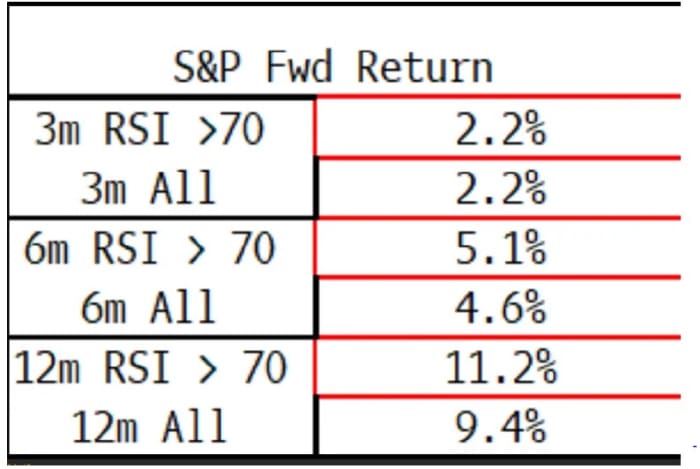
Source: Fundstrat
The good news for index-tracking traders is that neither the Nasdaq Composite on 62.6 or the S&P 500 on 66.9 have RSI in overbought territory. Germany’s DAX
DX:DAX
on 77.6 and Japan’s Nikkei 225
JP:NIK
on 81.2 do look vulnerable to, at least, a short-term pullback.
And to show how useful as a short-term contrarian indicator the RSI can be, consider Super Micro Computer
SMCI,
Fired up by AI-related frenzy and option buying by the Wallstreetbets crowd, shares in the computer-server provider rose way above $1,000 on Feb. 16, pushing its RSI to more than 98. Buying at such an extreme overbought level was a very bad move that day with the shares finishing the session about 25% lower from the peak.
Markets
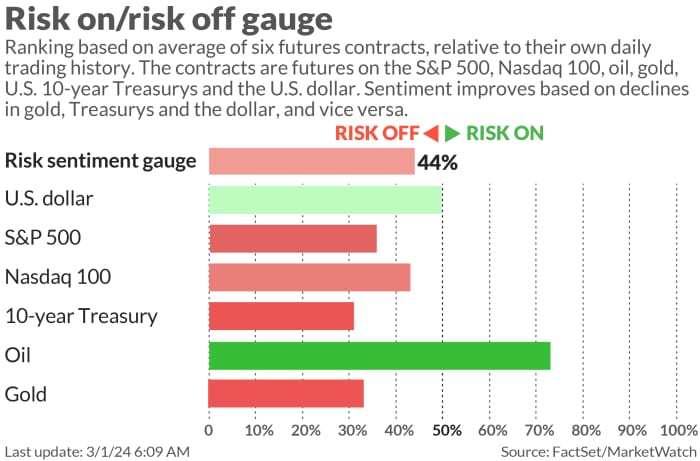
U.S. stock-index futures
ES00,
YM00,
NQ00,
are a bit lower as benchmark Treasury yields
BX:TMUBMUSD10Y
dip. The dollar
DXY
is little changed, while oil prices
CL.1,
rise and gold
GC00,
trades around $2,050 an ounce.
| Key asset performance | Last | 5d | 1m | YTD | 1y |
| S&P 500 | 5,096.27 | 0.18% | 3.87% | 6.84% | 28.00% |
| Nasdaq Composite | 16,091.92 | 0.31% | 4.75% | 7.20% | 40.38% |
| 10 year Treasury | 4.266 | 1.50 | 24.33 | 38.51 | 30.64 |
| Gold | 2,059.30 | 0.66% | 0.11% | -0.60% | 10.55% |
| Oil | 79.15 | 3.37% | 9.32% | 10.96% | -0.89% |
| Data: MarketWatch. Treasury yields change expressed in basis points | |||||
For more market updates plus actionable trade ideas for stocks, options and crypto, subscribe to MarketDiem by Investor’s Business Daily.
The buzz
U.S. economic data due on Friday includes the final reading of S&P manufacturing for February at 9:45 a.m. Eastern. Then, at 10 a.m., the February ISM manufacturing, January construction spending and February consumer sentiment reports will be released.
Federal Reserve officials making comments include Dallas Fed President Lorie Logan at 10:15 a.m., Fed Governor Chris Waller, also at 10:15 a.m., Atlanta Fed President Raphael Bostic at 12:15 p.m., San Francisco Fed President Mary Daly at 1:30 p.m., and Fed Gov. Adriana Kugler at 3:30 p.m.
Elon Musk has filed a lawsuit against OpenAI and its chief executive Sam Altman, alleging the ChatGPT-maker’s alliance with Microsoft
MSFT,
has compromised the start-up’s original mission of building artificial intelligence systems for the benefit of humanity.
Shares in New York Community Bank
NYCB,
are down 27% in Friday’s premarket trading after replacing its CEO and reporting weaknesses in its accounting protocols.
NetApp
NTAP,
stock is jumping 17% after the data storage group issued strong guidance for 2024, while well-received earnings are lifting Autodesk
ADSK,
shares 9%.
Manufacturing in China contracted for a fifth consecutive month in February, according to an official survey of factory managers.
Best of the web
Why the stock market ‘doesn’t look very bubbly’ to Ray Dalio right now.
What it’s like to live in the most polluted place on earth.
AI startup making humanoid robots raises $675 million with Bezos, Nvidia in funding round.
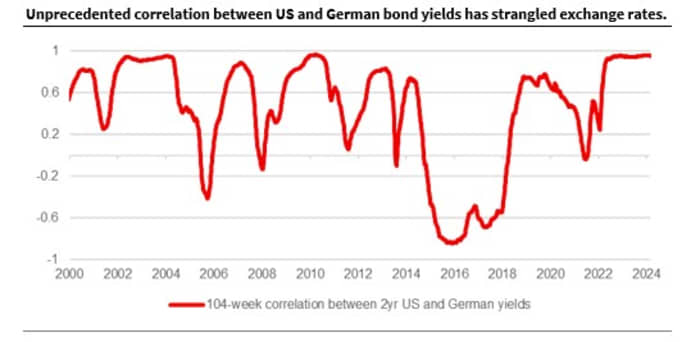
The chart
The dollar and euro
EURUSD,
have moved within a fairly tight range between $1.07-$1.10 for much of this year. Kit Juckes at Societe Generale explains why. “The foreign exchange market thrives on differences – in growth, balance of payments, politics, inflation but most of all, monetary policy,” he says. Policy is expressed via short-term bond yields and the chart shows the 2-year German yields
BX:TMBMKDE-02Y
are tracking 2-year Treasuries
BX:TMUBMUSD02Y
“to an unprecedented degree.”
Top tickers
Here were the most active stock-market tickers on MarketWatch as of 6 a.m. Eastern.
| Ticker | Security name |
|
NVDA, |
Nvidia |
|
TSLA, |
Tesla |
|
AMD, |
Advanced Micro Devices |
|
SOUN, |
SoundHound AI |
|
PLUG, |
Plug Power |
|
NIO, |
NIO |
|
AAPL, |
Apple |
|
AMC, |
AMC Entertainment |
|
MARA, |
Marathon Digital |
|
PLTR, |
Palantir Technologies |
Random reads
Bike vigilantes.
A very small frog.
The Devil’s playground.
Need to Know starts early and is updated until the opening bell, but sign up here to get it delivered once to your email box. The emailed version will be sent out at about 7:30 a.m. Eastern.
Check out On Watch by MarketWatch, a weekly podcast about the financial news we’re all watching – and how that’s affecting the economy and your wallet. MarketWatch’s Jeremy Owens trains his eye on what’s driving markets and offers insights that will help you make more informed money decisions. Subscribe on Spotify and Apple.
Source link

:max_bytes(150000):strip_icc()/latestGainersLosers-da3dc30744c44554b28966c4ea038d8e.png?w=390&resize=390,220&ssl=1 "Resmed Soars Amid Strong Demand for Sleep Devices")
:max_bytes(150000):strip_icc()/GettyImages-2141342223-30fa8b1e69564581aab5dd8c7ca34dae.jpg?w=390&resize=390,220&ssl=1 "Nearly 141,000 People Filed Taxes Online Directly With IRS This Year")
:max_bytes(150000):strip_icc()/INV_EliLillyHQ_GettyImages-1252633286-53307b32ebae47219077b51da856459a.jpg?w=390&resize=390,220&ssl=1 "What You Need To Know Ahead of Eli Lilly’s Earnings Report Tuesday")